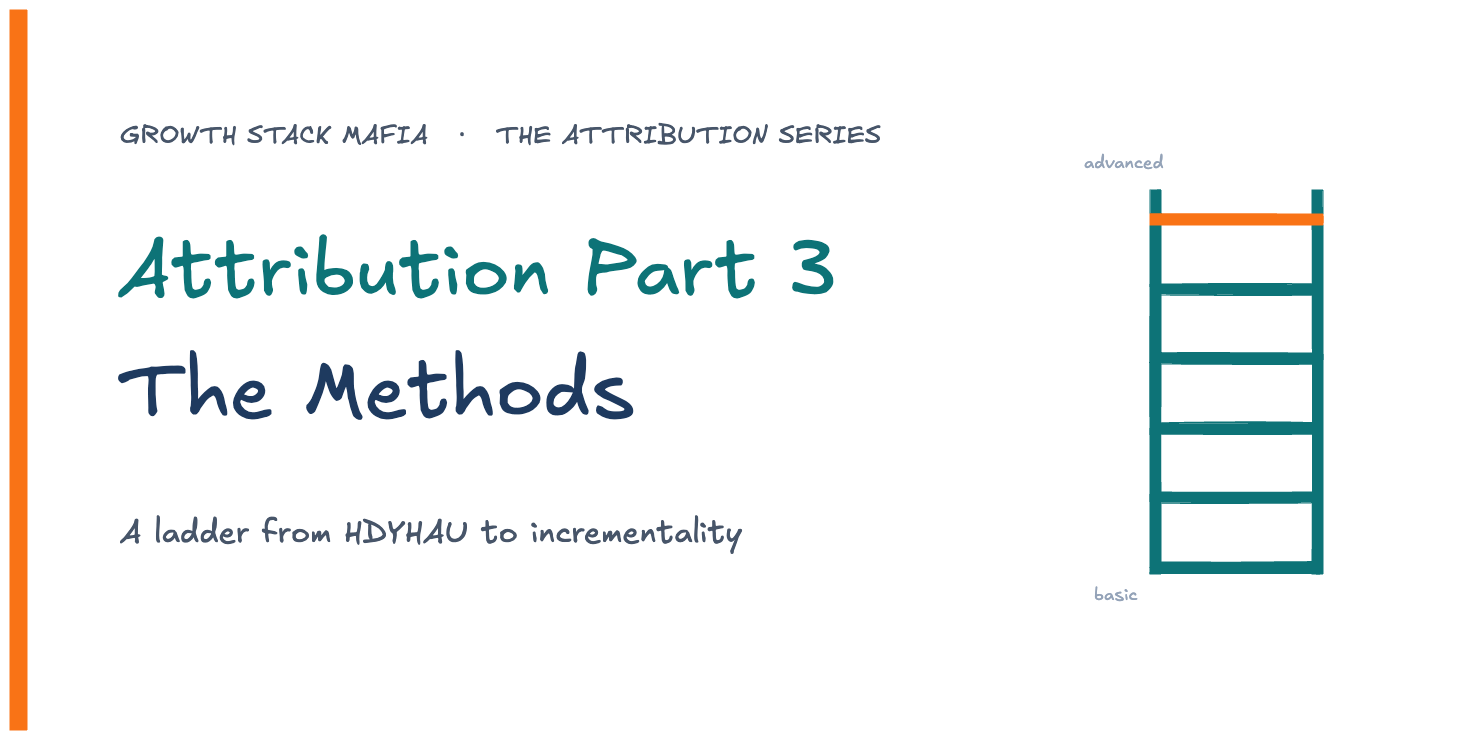
Attribution Part 3: Methods
A ladder from HDYHAU to incrementality: what each method is, how it works, and when to use it.
This edition of Growth Stack Mafia is brought to you by Bright Data.
Bright Data Scraper Studio turns a plain-English description of the data you want into a running scraper API, with proxies, browser rendering, and CAPTCHA solving already handled.
Anyone who has run their own scrapers knows the hard part comes after you write them, when a site changes its markup and the whole thing breaks. Scraper Studio has a self-healing step that repairs the scraper code with AI when the page structure shifts, which is usually the part that eats my weekend.
Describe the data, get a ready-to-run scraper in about 10 to 15 minutes, then edit it in a hosted IDE
Runs on Bright Dataās own infrastructure: 400M+ proxy IPs, geo-targeting, retries, unlimited concurrency, and delivery straight to BigQuery, Snowflake, or S3
Free tier is 5,000 page loads a month with no credit card. Build a scraper free
Happy Thursday everyone.
We have spent three posts building up to this one. And youāve waited a long time since I first released parts I, and II. š As a reminder ...
Part 1 covered what data you can actually get on mobile. Part 1.5 was a long detour into the plumbing of web attribution, the UTMs and click IDs and referrer waterfalls and sessionization. Part 2 was about the gap between what people think attribution is and what it can really do for them: telemetry bias, type 1 and type 2 marketing errors, and the hardest lesson in the series, that even with perfect instrumentation you are seeing maybe half the picture.
All of that was groundwork. The point of building the technical acumen was to earn the right to have this conversation, which is the one everybody actually wants to have. What are the methods? How do they work? And when should you use each one?
To do it right I sat down with LONG TIME HOMIE Pranav Piyush . Pranav runs Paramark, co-hosts GTMN with me every Friday, and spent years doing this at Dropbox, PayPal and BILL before that. He has strong, specific opinions about every rung on this ladder, and a few spicy ones.
What follows are the ideas from that conversation, written up in my words. Where a take is distinctly Pranavās, Iāll flag it. The rest is me.
That is the frame here. Attribution methods are a ladder. You start at the bottom with basic clicks and impressions, and you climb through HDYHAU, first and last click, MTA, MMM, and finally incrementality and probabilistic modeling. You donāt skip rungs. You climb to the one your stage and your telemetry can actually support.
With that... Letās climb!
Rung 0: Clicks and impressions
All businesses start at the floor. In practice, this just means ... do the simple and obvious stuff. Slap in a CDP or a tag-enabled tracker. PostHog, Amplitude, Hightouch ... GA 𤢠... or whatever you like on your site, track page views, and read and categorize your referrers.
If your channel mix is simple, this is close to all you need. Pranavās own company is the clean example. The primary channel for him is LinkedIn, showing up every day and doing the work and not much else, so when he wants to know if it is working he opens his web analytics and looks at referrals. If LinkedIn shows up right after Google, great. If LinkedIn is not showing up at all, he has a problem.
That is the whole method at this stage. Simple mix, simple tracking, more finding your way on gut and intuition than anything else. The trouble starts later, when you have raised a big round and you are running five or six or ten channels to keep growing, because now youāre trying to answer the question āhow do I consider where to allocate resources as f(time, money, people, attention, tokens)ā. Not everybody clicks through from every channel, so the referrer only ever sees a slice. Intuition begins to erode as the only significant lever.
Rung 1: HDYHAU
Ah, the promised land. The simple HDYHAU. How Did You Hear About Us. A form field on your conversion action that asks the customer directly. When your mix gets complicated and the referrer starts lying to you, this is where you go, and it is a better tool than most people give it credit for.
I have argued with many dim-witted product operators about the HDYHAU. So letās put the kibosh on that first. If a PM or anyone else says āwell, we canāt have a HDYHAU because itās another click in the funnel,ā then please escort them to Exhibit A with Elena Verna. This is such a simple-minded approach. In a world of decreasing intelligence around attribution this is one of the most powerful, easy tools to deploy. If customers are so disturbed by a single step in the funnel that they bounce then Iād argue you have way bigger problems than the funnel.
In addition to this mistake, many people also build it wrong. Two things matter.
First, the shape of the form. Put your common channels up top as options, and always leave a freeform box at the bottom. The old knock on freeform was that people type garbage like āinternetā or āsearch.ā True, but it barely matters now, because grouping and categorizing a pile of freeform answers is a five minute job for Claude against your SQL. So you get the structure of options where it helps and the open box for everything you did not think to list. Add a new channel to the options as you launch it.
Second, do not get cute with your buckets. Nobody thinks in āorganic searchā versus āpaid search,ā so just say Google. Nobody remembers whether they saw you in the Instagram feed or in stories, so just say social and put the specifics in parentheses. Keep it to five or six options, max. Fifteen options is fake precision, and every option you add nudges people toward answering the way you framed it.
The reason to run HDYHAU is that it gives you a directional read you cannot fake. You put $50k into TikTok this month. Did even five people say TikTok in the box? If the answer is zero, something is wrong, no matter how many views and comments the channel is throwing off. Views are not the point. Somebody telling you TikTok is how they found you is the point.
Rung 2: First and last click
This is the rung most companies reach at some stage in their journey, and it is the one they implement worst. Itās also arguably the biggest bang for your buck and where most companies should stay for longer (before moving on to advanced methods).
As we covered back in Part 1.5, this method is just capturing first and last clicks and saving them as events and user attributes in your CDP.
The failure in this method is almost never the model. It is that the model was never written down. A team collects utm_campaign, everybody assumes it is last touch, and nothing in the instrumentation says so. Somebody new comes in, looks at the data, and cannot tell whether they are looking at first or last. You have left it to tribal knowledge.
It does not really matter which one you pick. Pick one, and make your telemetry loud about the choice. If you are collecting UTMs on first touch, then label the fields first_utm_source, first_utm_campaign, and so on. Now there is no ambiguity, and if you want to add last touch later you copy the logic and write a bit of code.
There is a real question of where that logic should live, on the client or in SQL, and the answer connects back to a rule from Part 1.5: be clear about where it lives and why. You can hold first and last in the parameter name on the client, or you can derive it at the data layer with a query that lists every channel in a session by timestamp and grabs the first or the last. Either is fine.
What is not fine is the two issues I see constantly. One is teams that force everything into SQL when a little client-side structure would have saved the data team days of work. The other is teams that do zero cleanup on the client, ship a garbage volcano of raw events, and leave analytics to sort out what any of it means.
Something I want to push hard against here is inference. Some tools, and AppsFlyer is the example I dug into, will fill a missing parameter by reaching for another one and stuffing it in. Do not do that. If the parameter exists, collect it and let that be the real, observed state. If you want to infer something on the back end, do it in SQL where everyone can see the assumption, not silently on the way in.
There is a timely reason to care about all this. Meta just changed how it does click attribution, and the head of their marketing analytics said the reason: they wanted to mirror what shows up in Google Analytics. For years a āclickā in Metaās world could mean any engagement with a post. In Googleās world a click means an actual visit. So Meta reversed fifteen years of definition and invented separate labels, engaged-through and view-through, to keep the plain click clean. Take the lesson. Whatever you call a click or a touch should be an actual click or touch. That is the only way your Google Analytics ever reconciles with your internal Looker dashboard, and the reason those two numbers usually disagree is that somebody made up a definition instead of collecting the real one.
One prerequisite sits underneath this whole rung. Do not build any of it unless you are actually running experiments and changing what you do. Telemetry and dashboards that never drive a decision are for show only.
And you can get a long way with almost nothing. Pranavās version is a plain spreadsheet: spend, impressions, and clicks or the channel equivalent, laid out channel by channel, day over day and week over week, with your conversion metric across the top. No UTMs in it, no click IDs or other fancy shit. Drop it in a browser and you can ask Claude whether your conversions moved when you ramped LinkedIn spend, and it will run the correlation for you. It is so easy to do now that it is strange more marketers are not looking at it every week.
(Maybe we should do a workshop for founding marketers? DM me if you think this would be useful)
Rung 3: MTA
Multi-touch attribution. The promised land everybody wants to reach, and the one I distrust more than any other (Pranav too).
The idea is seductive. You saw an Instagram ad, did not click, and three days later opened your work laptop and typed granola.com and signed up. MTA is the attempt to connect that ad impression to that signup and hand fractional credit to Instagram instead of writing it off as direct or organic.
The trouble is that the system can only ever see the part of your journey that is visible to computers, and that ad on your personal phone left no trail the signup on your work laptop can find. Vendors will tell you they solve this with a Facebook pixel, or identity resolution, or device fingerprinting, or IP matching. Maybe some of them stitch personal and work together some of the time. But then you are left with the harder question anyway: did the ad actually change what that person did, or were they going to type granola.com regardless because a friend told them about it last week?
Then there is a data-construct problem that kills a lot of MTA in practice. Some of your identifiers are deterministic at the user level. Others are anonymous at the campaign level, a big blob of Instagram impressions you cannot tie to a person. To combine them you have to drop everyone down to the least specific version, which means campaignifying the deterministic data too, which defeats most of why you wanted MTA in the first place.
And when you do build it, you pick weights. Every TikTok view counts 10%, every Google click counts 20%, you fractionalize each touch and sum by channel, and out pops a beautiful chart. But you chose those weights, and in any large org that choice is political, because everyone wants their channel to count more. I watched this at a company where partnerships, which was not even a paid channel, spent its energy fighting marketing for credit in the model. That is the environment MTA creates, and it is fine if everyone agrees the tool is just a tool and the output does not decide budgets. It never stays that way. People take the chart and move money with it.
So the verdict is simple. If you are choosing between MTA and HDYHAU across five or ten channels, HDYHAU wins. If you are going to do MTA anyway, keep it to real physical touches, never touch view-through or engage-through, and understand that all it can honestly optimize is the very bottom of the funnel, because a touch by definition happens at the end. The one place it genuinely earns its keep is personalization. If someone clicked through from an email about X, make the landing page about X. That is a good use of session data. It is just not attribution, and we bastardized the word a little when we started calling it that.
You are seeing 50%, not 90%
I guess this is what AI might call a āHARD TRUTHā. Or a āLOAD BEARING ASSUMPTIONā š We hit this back in Part 2, but it is the load-bearing one, so here it is again.
Most people think they can track 80 to 90% of their marketing. I think that in the best circumstances, with the best telemetry, you are seeing about 50%. Every digital channel is under attack from privacy, and deterministic tracking that was close to pure around 2019 has been eroding ever since. So even good coverage now often tells you how many people you saw at a campaign level without telling you which people they were.
And all the methods on the lower rungs miss the same enormous category of things: word of mouth, the billboard you drive past, the ad in the subway, the way somebody feels and comes back six months later. With basic tools you are, at best, using data to flip a coin. A Series C running a lot of channels on thin telemetry is better off leaning on intuition and simple tools than on an elaborate MTA build that creates strife and still gets it wrong.
None of that means you give up on being rigorous here... It means you get a leeetttle bit more honest about where rigor is even possible, and you reach for the heavier methods in the specific cases where they can deliver real precision. Frankly, most companies pre-Series C, pre complexity donāt need these tools. They are chasing them because a CMO told them to, or they read something on LinkedIn or they think they have to. Plenty of world class marketing teams operate on the bare minimum for a lot longer than youād expect.
There is a lovely low-tech version of this. Pranav has a customer advertising on podcasts, where the telemetry is basically nonexistent and the only hard number is spend. So they record their sales calls, query Gong for how often each podcast gets named, and use that as a directional read. If people keep mentioning the show unprompted, it is probably doing something. That does not belong in an attribution model, and it does not need to. It is a reasonable way to justify a decision.
Whatās cool about this example is that itās a nondeterministic method. You could build a claude or codex skill that runs on a cron or routine. You could do this for all your channels, and daily or weekly you get an assessment of āis this workingā that is partly numbers (record and distill mentions over time) but a lot more based on conversation which is rich in detail.
Rung 4: MMM
The next rung. Marketing mix modeling. This is where you climb when you want real precision back, and it works in a completely different way from everything below it.
MMM does not touch UTMs or click IDs or touches at all. It looks at the relationship between a channelās trend line, its spend and impressions and engagement over time, and your output metric, meaning total conversions however you define them internally. When your LinkedIn impressions go up and your signups go up, and they fall together too, over six or twelve months, the model reads a strong relationship. When your TikTok impressions swing around and your signups stay flat, it reads a weak one.
The reason it levels the playing field is that every channel produces a time series. Paid, earned, PR, owned email, outbound, webinars, all of it. There is no channel that cannot be represented, which is exactly what first and last click and MTA could never say.
Mechanically it is more approachable than people expect. Take the common B2B stack, Segment collecting web data into Snowflake, dbt on top, Hightouch downstream. You already have spend and impressions and conversions by day sitting in the warehouse. You go get an open source package, Googleās is Meridian and Metaās is Robyn, both well documented, and you run it locally on that data frame. It is a Python or R script sitting on top of your source data.
(If youāve taken some statistics courses, Iād argue you could self run one of these models using AI. but beware of accuracy and interpretation)
Then you configure it, because the out-of-the-box run gets you started but you will need to tune it. Seasonality is the big one. If you know your business spikes hard in Q1 and slides the rest of the year, or peaks in Q1 and again in Q3, feed that in, because the model gets meaningfully better when it knows what you already know.
What comes out the other side is a set of outputs. Some describe the quality of the model itself, statistics like R-squared and MAPE that tell you whether to trust it. If the fit is bad you go figure out why. If it is good, you get your conversions split into incremental and baseline, where incremental is what your marketing investments drove and baseline is the built-up brand equity, word of mouth and organic demand that would have shown up anyway. The incremental piece breaks down by channel. And you get diminishing-returns curves, so you can see whether $50k a month in a channel is still scaling roughly linearly or flattening out. You can DIY a basic version of this at Series A or B. It gets genuinely hard once you layer in pricing and packaging changes or the occasional viral peak.
Rung 5: Incrementality
Everything below this rung is correlation. This is the only rung that attempts to give you causation.
When an MMM hands you an āincrementalā number, that is an estimate of incrementality, not observed causal incrementality. The only way to actually get the causal version is to run an experiment. āIncrementality testing,ā which is jargon I do not love, just means running experiments, and an experiment has three parts.
You need a control. Think about how many times a team has said āletās test itā and then just launched something with nothing to compare against. That is not a test, it is a random act of marketing, and by that standard maybe 99% of testing in marketing is not testing.
You need statistical power. Same as an A/B test on your site: know your baseline for the metric, then calculate how much lift, how much budget, and how much time it takes to get a valid answer. There is nothing different about your media mix here. The math is the math.
And you need a real hypothesis with a stake in the ground, which is where you should actually start. āLetās test Metaā means nothing. āWe think we can get an incremental 5% in conversions at a cost per conversion of $50ā is a hypothesis. If you cannot even name an acceptable target CAC, you should not be running the marketing team.
The last piece is what tech bros might call ātasteā. If a test comes back with no lift, the unsophisticated move is to write off the whole channel: Meta doesnāt work, billboards donāt work, YouTube doesnāt work. That is not what a null result means. It means that particular execution didnāt produce lift. You learn from it and put a better foot forward. You can run five that go nowhere and a sixth that is a smashing success, and you would never have reached the sixth if you quit at the fifth.
Two very different things called ātestā
Letās talk about testing for a second. Because in all of these ladder rungs, thereās this underlying concept of a test or an experiment. You hear it constantly:
āLetās run a new channel experiment.ā
āI want to experiment with marketing.ā
āWeāre taking a bunch of bets.ā
āTestā gets used two ways that people constantly conflate. One is the political version. You have a room of people at equal status, no clear decision-maker, and gridlock. āLetās run a testā becomes the graceful way to move forward without anyone having to fully commit. This is a real and useful thing to do (and I do it ALLLLL the time; I thank Tanner McGrath for teaching me this implicitly during my time at Runway, where I hit constant hurdles getting people to agree). The other is an actual controlled experiment run for certainty about whether something works.
Both are legitimate tests. The problem is doing the first while believing you did the second, because then you take an outcome that was never designed to be conclusive and treat it as proof. So say which one you are doing upfront and try to be thoughtful about it.
For example, as Pranav notes... At the start of the year, take your annual goal, say a 70% increase in your conversion metric with a $100 CAC guardrail, and build an experiment roadmap from January to December. Treat it like a product roadmap, a learning agenda of your best hypotheses all pointed at that number. That is a much cleaner way to think than running one-off tests to break a political logjam and hoping the results mean something.
The thing under the whole ladder
If you take one idea from this post, I hope you take this ...
When an MMM output tells you Meta drove 10% of your conversions, that is not the real output. The real output is a range, maybe 7% to 12%, and 10% is just the median, because that is the number that fits in a chart.
Every value these models produce is a distribution of possibilities. Some come back with a tight range and some come back wide, depending on how granular your data is, how long you have collected it, and how much it has varied. That is the whole difference from MTA, which confidently tells you the answer is X. MMM tells you the answer is X plus or minus something, and the plus or minus is the honest part.
Okay, some parting advice and wrap ... First, go learn some statistics, and try to narrow learning to three ideas. Probability and uncertainty, the coin-flip intuition of what actually happens when you flip ten coins, then a hundred people flip ten coins each. Correlation, which you can run against your own marketing data all day. And causation. Spend a weekend on those three and you will be materially better at this job than the marketer next to you who never did.
Where this leaves us
Back to where the series started. Attribution is navigation, not GPS. You are reading the stars to figure out roughly where you are, and there is real science in that, but there are things out there you will never see or predict cleanly.
The ladder is not a race to the top rung. It is about standing on the rung your stage and your data can actually hold, and using a few different lenses at once instead of chasing one clean number that does not exist. HDYHAU at the bottom. A well-labeled first or last touch when you start running real experiments. MMM when you want to weigh every channel on the same scale. Incrementality when you need to know something is causal. And under all of it, the humility that you are working with half the picture and a distribution of maybes.
Hope you enjoyed.
If you made it this far, you now know more about attribution than most of the people who will confidently tell you their MTA dashboard is the excellent. Also if you made it this far maybe you are a real person because nobody loves attribution this much.
See you on the next rung.
Additional Reading
The series so far: Attribution Part 1, Part 1.5: Web Attribution, and Part 2: Ignorance to Enlightenment.
The tools we mentioned: the open source MMM packages, Google Meridian and Meta Robyn. And GTMN, the weekly Go-To-Market News show I co-host with Pranav.
Go deeper (one great read each):
What is Marketing Mix Modeling?. Pranavās team at Paramark, a clean primer on modern MMM.
Diversified Marketing Measurement: MTA, MMM & Experiments. Rockerbox on why you triangulate methods instead of picking one.
How todayās top consumer brands measure marketingās impact. Lenny Rachitskyās operator survey of MTA, MMM, and lift studies.
Your guide to CAC payback period. Kyle Poyar / Growth Unhinged on the unit-economics lens most teams miscalculate.
All things Peter Fader and probabilistic marketing.


